Some Texas Notes for Election Day 2020
A dramatic increase in competition between the two parties amidst an early voting surge that has seen Texas leading the country in turnout so far has thrust the state closer to center stage in the fateful final days of the 2020 election. We thought it might be useful to flag some aspects of data from polling and historical voting records that prove useful context for reporting on the 2020 election in Texas. We’ve also used our search tool to gather all of the relevant results from polling we’ve conducted for the 2020 election over the last cycle in our poll archive.
As Election Day voting takes place, we’ve also rounded up a few relevant data points on several aspects of the election that help shed some light on a very uncertain electoral environment in Texas. If you want to jump to subjects of specific interest, you can use the internal links below.
| Texas Independents | The Latino Vote |
| Ticket splitting? | Impact of COVID-19 on voting |
| The Polling | When we'll know who won |
| Trust in the outcome | Eyes on Houston |
| The suburbs |
Independents in the 2020 Election. While we know a lot about the share of voters with Republican or Democratic primary history thanks to consultant Derek Ryan’s regular and very useful early voting data reports, there are about 1.69 million voters who have already cast a ballot without a primary or general election voting history in Texas and about 2.9 million general election-only voters who haven’t yet cast their ballots. Together, these two groups make up more than 47% of the votes. We may know how the vast majority of partisans will vote, but here’s an examination of how independents look different in 2020 compared to previous elections based on University of Texas/Texas Tribune polling. Increasingly negative attitudes toward Donald Trump are likely major drivers, as the following graphics illustrate.
The Latino vote. There’s been a lot of discussion of Joe Biden’s support, or his lack of expected support, among Hispanics. Commonly lost (or, to be fair, disputed) in this discussion is that Texas Republicans regularly enjoy the support of 30-45% of the Hispanic voting electorate in Texas. (This group is a subset of Hispanics overall.) How well the GOP does in this range, and the extent to which the Hispanics who enter the electorate for the first time in 2020 look like the Hispanics who have traditionally voted in Texas elections, will go a long way in determining how competitive Texas is in 2020 once the votes are actually counted. The graphics below look at the trend in responses to our statewide item asking about welcoming the respective major parties are to "people like you." The universe in these items is made up self-declared registered voters.
The suburban battlegrounds. The suburbs are once again a focus of attention. This is understandable, given the demographic dynamism of the Texas suburbs and the ways that dynamism has fed two or three elections worth of increasing competition between the parties in Congressional and legsislative contests, as well as big partisan shifts in the vote totals in suburban counties like Fort Bend, Collin, and Hayes, just to mention a few of the most prominent. On the other hand, beware over-interpretation of shifts in suburban geographies that hinge on imputing mass Republican defections because of Donald Trump (especially among women). There is little direct evidence of more than marginal GOP defections, even if those marginal defections *are* contributing to the erosion of the advantage he enjoyed in 2016. More likely, the suburbs are increasingly competitive in Texas because they're growing rapidly, and doing so with the addition of young, diverse Texans.
The potential for ticket splitting. 2020 will be the first election in Texas since the Texas Legislature did away with straight ticket voting in 2017.* A related question being asked is whether John Cornyn could/can win Texas if Joe Biden also wins here — with the sometimes implicit, sometimes explicit idea that some Republicans, and/or independents, might vote for Biden at the top of the ticket, but then continue supporting Republicans down ballot. There’s no evidence suggesting this is going to happen very frequently in our polling. First, Donald Trump's job approval among Texas Republicans has remained astronomically high throughout much of his presidency, with the slightest of erosions likely caused by the pandemic erased in the final month of the campaign. Second, among Texas voters who said that they would be voting for Joe Biden, 82% said that they would support M.J. Hegar (6% John Cornyn), while 90% said that they would vote for their Democratic Congressional candidate (2% said Republican). Among Trump supporters, 88% said that they would be supporting John Cornyn in his Senate race (3% say M.J. Hegar), while 92% say that they will support the Republican candidate with their congressional vote (2% say Democrat).
The impact of the COVID-19 pandemic. We’ve already written extensively about the declining concern over COVID in Texas, and, in particular, among men, and among Republicans. Expect more Republicans than Democrats to show up on election day, based on history, stated intentions, and GOP voters’ comparative level of concern over the pandemic. Functionally, this means that if you’re a Texas Democrat, don’t pop the champagne if early voting numbers suggest narrow Democratic advantages.
Making heads or tails of the presidential polling in Texas. The polling has been tightening in Texas over the last month, but is really all over the place. This reflects two factors: (1) Texas is competitive now, and under these new conditions, it’s hard to estimate if the electorate prefers Trump 51-49, or if it in fact prefers Biden 51-49 (this is a hard estimate to get right). Making things significantly more difficult is that (2) Texas will likely have north of 12 million voters in 2020, which would be approximately 3 million more than in 2016 or 2018. What exactly that electorate looks like is anyone’s guess at this point, and we’re seeing a lot of guesses:
| Poll | Field Dates | Sample Size | Sample Composition | MOE | Trump | Biden | Spread |
|---|---|---|---|---|---|---|---|
| Emerson College | 10/29-10/31 | 763 | Likely Voters | +/-3.5% | 49 | 49 | Tie |
| Morning Consult | 10/22-10/31 | 3267 | Likely Voters | +/-2% | 48.1 | 48.1 | Tie |
| Public Policy Polling | 10/28-10/29 | 775 | "Texas Voters" | ND | 48 | 50 | Biden +2 |
| UMass Lowell Center for Public Opinion | 10/20-10/26 | 873 | Likely Voters | +/-4.2% | 48 | 47 | Trump +1 |
| Univision/University of Houston | 10/17-10/25 | 758 | Registered Voters | +/-3.56% | 49 | 46 | Trump +3 |
| New York Times/Siena College | 10/20-10/25 | 802 | Likely Voters | +/-3.8% | 47 | 43 | Trump +5 |
| Data for Progress | 10/22-10/25 | 1015 | Likely Voters | +/-3.1% | 48 | 49 | Biden +1 |
| University of Houston Hobby School | 10/13-10/20 | 1000 | Likely Voters | +/-3.1% | 50 | 44.7 | Trump +5.3 |
| Dallas Morning News/UT Tyler | 10/13-10/20 | 925 | Likely Voters | +/-3.22% | 45 | 48 | Biden +3 |
| Morning Consult | 10/11-10/20 | 3,357 | Likely Voters | +/-1.7% | 47 | 48 | Biden +1 |
| Quinnipiac | 10/16-10/19 | 1145 | Likely Voters | +/-2.8% | 47 | 47 | Tie |
| Morning Consult | 10/2-10/11 | 3455 | Likely Voters | +/- 1.7% | 49 | 47 | Trump +2 |
| Public Policy Polling/Texas Democratic Party | 10/7-10/8 | 721 | "Texas Voters" | ND | 48 | 49 | Biden +1 |
| Crosswinds Texas Pulse | 10/5-10/6 | 1000 | Likely Voters | +/- 3% | 51 | 44 | Trump +7 |
| UT/Texas Tribune | 9/25-10/4 | 908 | Likely Voters | +/-3.25 | 50 | 45 | Trump +5 |
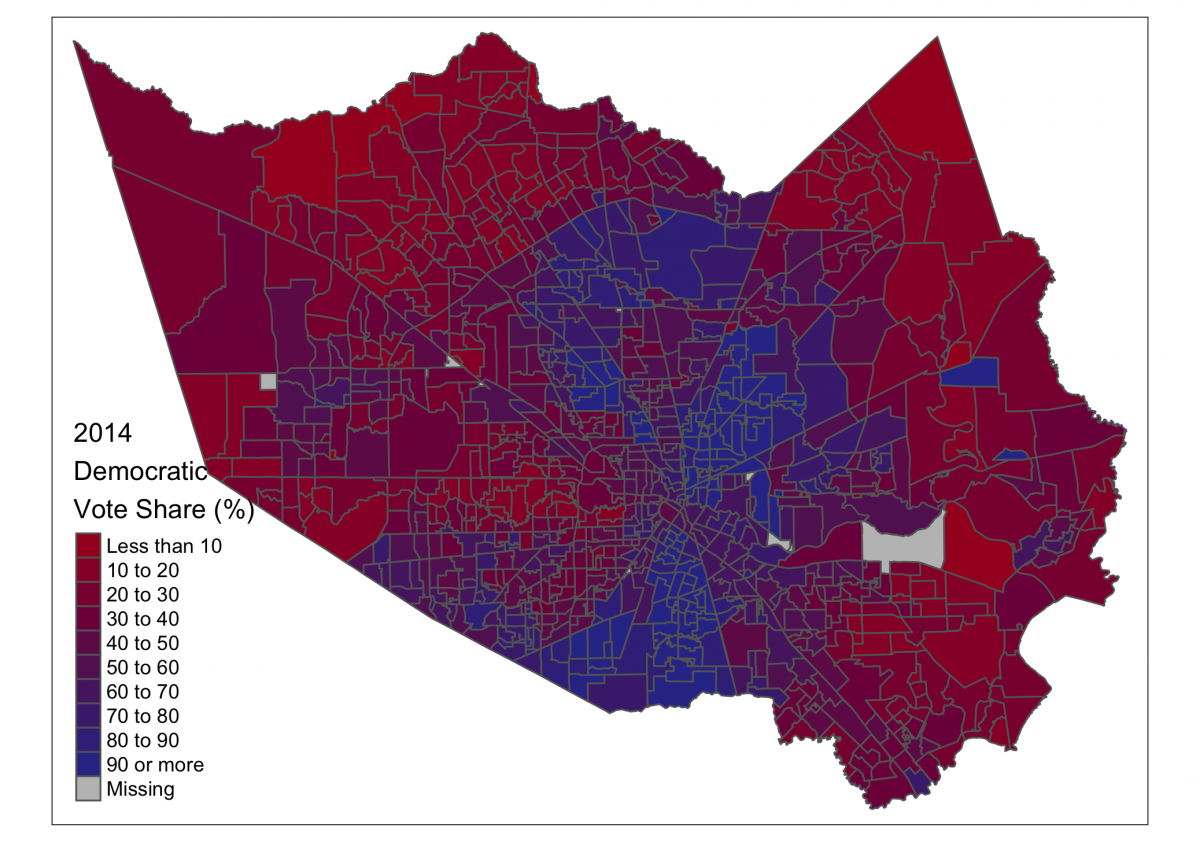
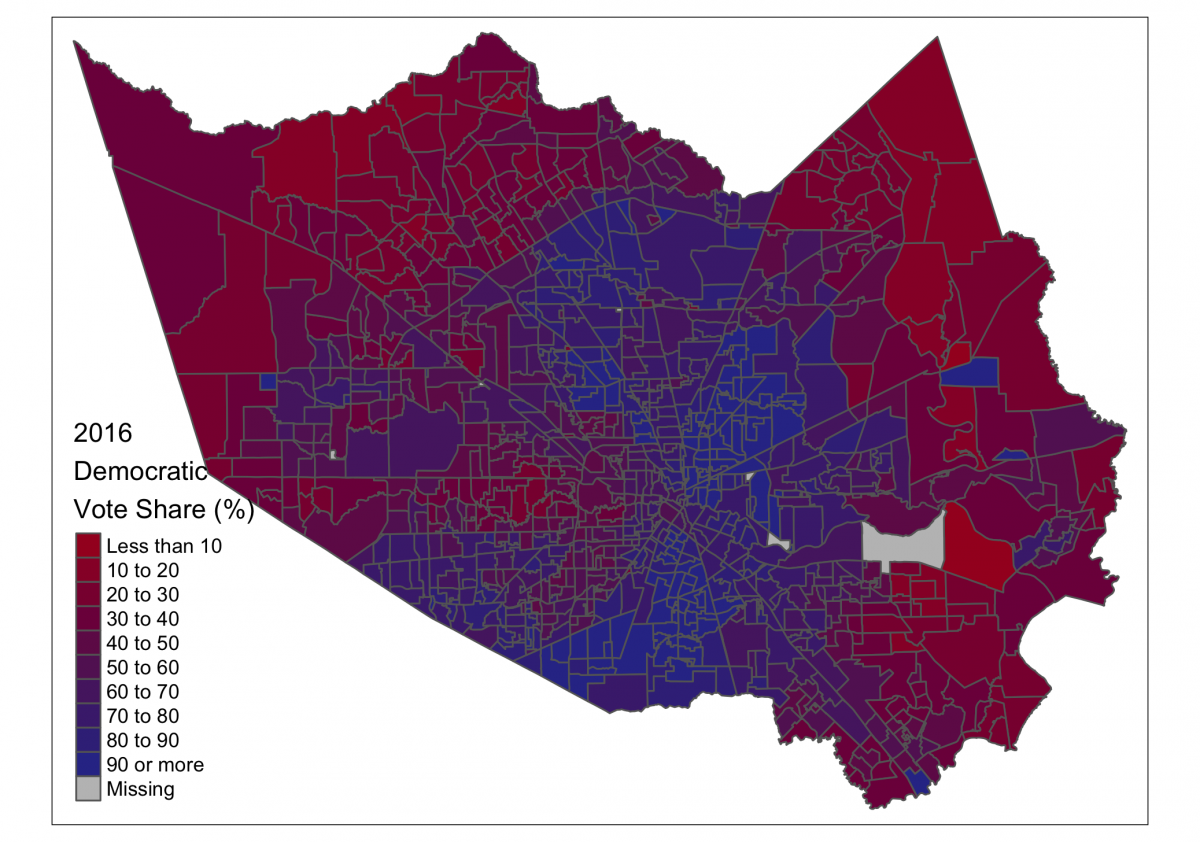
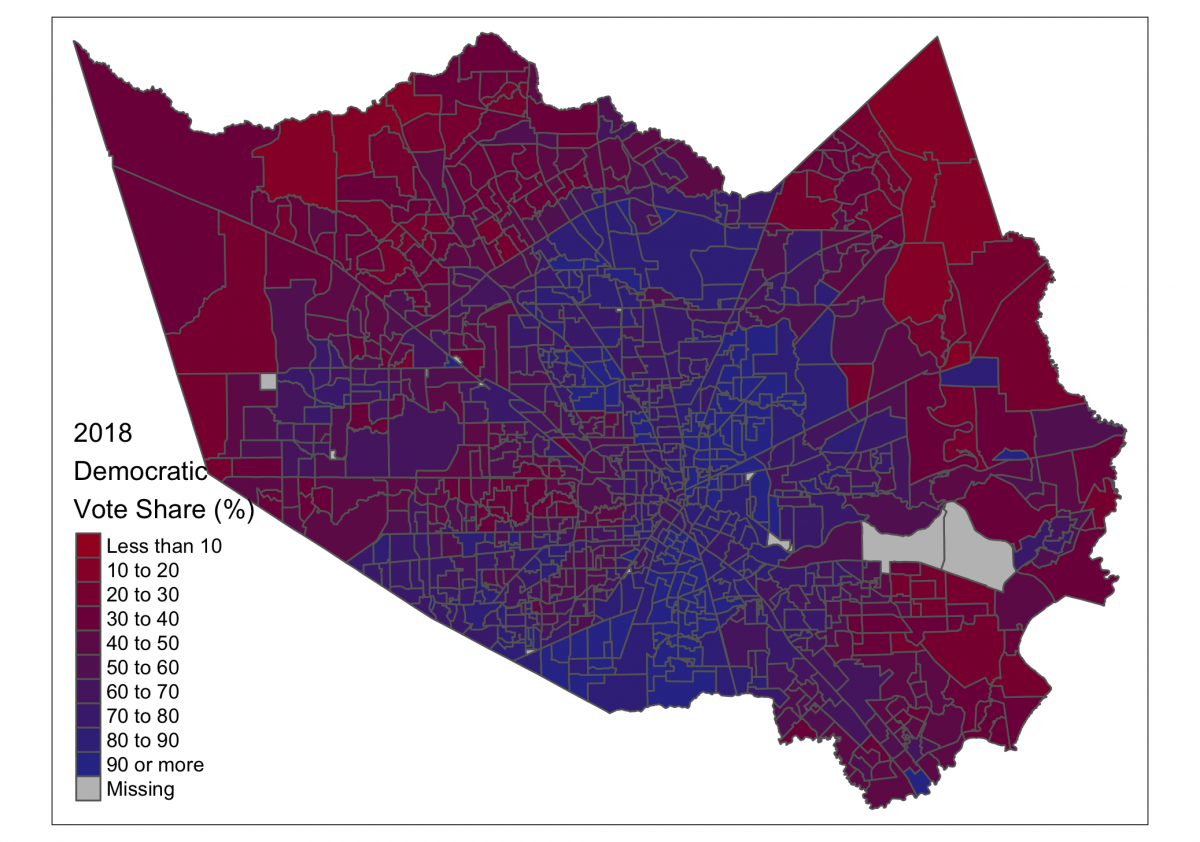
All eyes on Houston. Both inside and outside of Texas, the spotlight is on Houston and Harris County. Harris county produces the most votes in the state of any county (a little over 14% of the total votes cast in 2018 and 2016), and the broader region, including the surrounding counties, regularly makes up almost a quarter of the Texas vote. This region has shifted dramatically in the last three election cycles, from a Republican advantage of 220,000 votes in 2012, to a 27,000 GOP vote advantage in 2016, to a 66,000 vote Democratic advantage in 2018. This is a massive shift in the most populous county in the state, and why almost half (3) of the Democratic congressional targets in Texas at least touch the Houston region. The presidential result in Texas will rest in part on whether this tilt toward the Democrats continues to increase or levels off in the midst of a surge in turnout.


Texans’ expectations about when we will know who won. The majority of Texans don’t expect a winner in the presidential election to be announced on election night, and this is a very good and hopeful thing (see the next point). In fact, only 28% of Texans think we will know who won on Election Day, with another 23% who think that we’ll know within a few days. In a sea of discouragement, the fact that most Texans have learned not to expect a winner on election night counts as a small victory. Another good sign: There are not large differences in expectations between partisans.
Texan's unsteady trust in the results of the election. While Texans may not expect the winner of the presidential election to be announced on election night, too few expect that the American people, or even they themselves, will trust the results of the election. Only 47% of Texans expressed some confidence that Americans will trust the results of the election, and, most disconcertingly of all, only 41% said that they will trust the results of the election regardless of who wins — 46% were unsure, and 14% have already determined that the election is rigged beyond repair (by one side or the other, presumably).
Finally, if you’re interested in the historical context of Texas Democrats’ current efforts to challenge Republican dominance in the state, Henon wrote a column for The Washington Post’s “Made by History” section — thanks to Brian Rosenwald for the invitation to contribute and some patient editing.
* An earlier version of this incorrectly referred to the bill ending straight ticket voting passing int 2019, which was incorrect. Thanks to the Dallas Morning News' Bob Garrett for flagging the mistake in an exceedlingly civilized manner.
